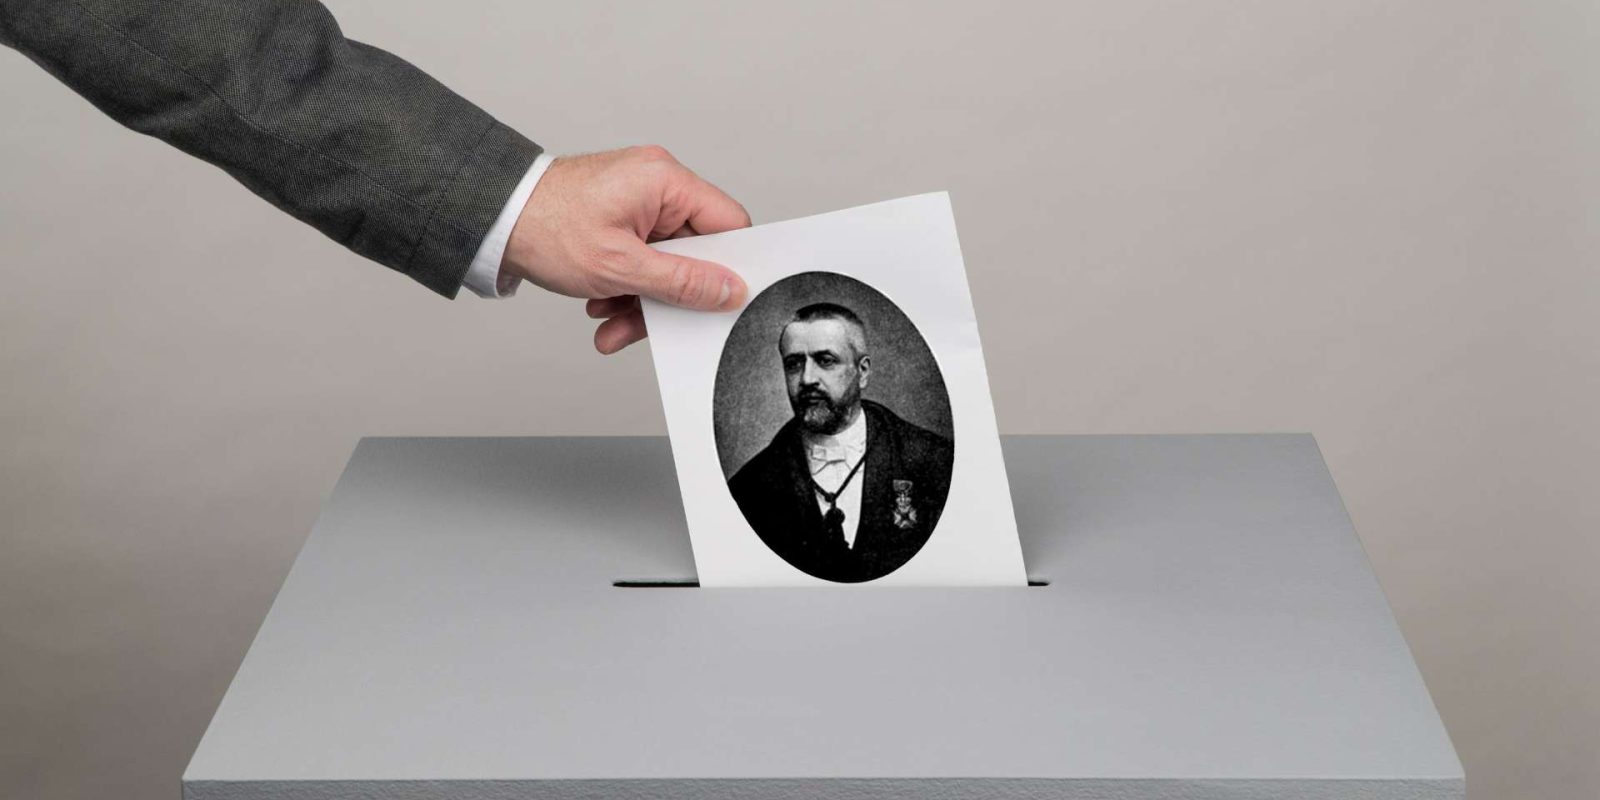
O método de Hondt
\(\Large J\)á por aqui tratei um pouco deste assunto. Desta vez, tal como desta, para trazer uma modesta amostra das potencialidades do shiny para R e para Python, agora potenciadas pelo WebAssembly (Wasm).
Madeira 2023
Copie os dados abaixo (canto superior direito da caixa) e cole-os na caixa de entrada da aplicação (Partidos e votos). Coloque o número de lugares (75 no exemplo da Madeira) e calcule a distribuição dos lugares pelo método de Hondt (ou Jefferson, se preferir).
PSD,49104
PS,28981
JPP,22959
CH,12562
CDS-PP,5374
IL,3481
PAN,2531
PCP,2217
BE,1912
PTP,1222
Livre,905
ADN,772
MPT,577
RIR,527
#| '!! shinylive warning !!': |
#| shinylive does not work in self-contained HTML documents.
#| Please set `embed-resources: false` in your metadata.
#| standalone: true
#| viewerHeight: 680
library(shiny)
library(bslib)
library(DT)
library(plotly)
# Function to calculate D'Hondt method seat allocation
calculate_dhondt <- function(votes, seats) {
n_parties <- length(votes)
party_names <- names(votes)
if (is.null(party_names)) {
party_names <- paste("Party", LETTERS[1:n_parties])
}
# Create quotients matrix
quotients <- matrix(0, nrow = seats, ncol = n_parties)
for (i in 1:seats) {
quotients[i,] <- votes / i
}
# Find highest quotients
allocated_seats <- numeric(n_parties)
names(allocated_seats) <- party_names
# Track allocation process
allocation_steps <- data.frame(
Round = integer(),
Party = character(),
Quotient = numeric(),
Seats = integer()
)
for (seat in 1:seats) {
max_val <- max(quotients)
winner <- which(quotients == max_val, arr.ind = TRUE)[1,]
party_index <- winner[2]
allocated_seats[party_index] <- allocated_seats[party_index] + 1
# Create a complete snapshot of all parties' seats for this round
current_seats <- numeric(n_parties)
names(current_seats) <- party_names
current_seats[names(allocated_seats)] <- allocated_seats
# Record step for all parties
for (party in party_names) {
allocation_steps <- rbind(allocation_steps, data.frame(
Round = seat,
Party = party,
Quotient = if(party == party_names[party_index]) max_val else NA,
Seats = current_seats[party]
))
}
# Set used quotient to -1 to exclude it from future calculations
quotients[winner[1], winner[2]] <- -1
}
return(list(
seats = allocated_seats,
steps = allocation_steps
))
}
# Function to parse party votes input
parse_party_votes <- function(input_text) {
# Split input into lines
lines <- strsplit(input_text, "\n")[[1]]
# Process each line
parties <- vector()
votes <- vector()
for (line in lines) {
if (trimws(line) == "") next
parts <- strsplit(line, ",")[[1]]
if (length(parts) != 2) next
party <- trimws(parts[1])
vote <- as.numeric(trimws(parts[2]))
if (!is.na(vote) && vote >= 0) {
parties <- c(parties, party)
votes <- c(votes, vote)
}
}
if (length(votes) > 0) {
names(votes) <- parties
return(votes)
} else {
return(NULL)
}
}
ui <- page_sidebar(
theme = bs_theme(preset = "shiny"),
title = "Simulador D'Hondt",
sidebar = sidebar(
width = 250,
textAreaInput(
"party_votes",
"Partidos e Votos:",
value = "Partido A, 100000\nPartido B, 80000\nPartido C, 60000",
height = "150px",
placeholder = "Enter in format: Party, votes"
),
numericInput("n_seats", "Lugares a Alocar:",
value = 7, min = 1, max = 100),
sliderInput("animation_speed", "Δt",
min = 0.1, max = 0.5, value = 0.3, step = 0.1),
tags$style(HTML("
.action-button {
height: 45px !important;
font-size: 0.85em !important;
white-space: pre-line !important;
padding: 3px !important;
margin: 2px !important;
width: calc(95%) !important;
}
.button-container {
display: flex;
gap: 4px;
padding: 0 2px;
}
")),
div(class = "button-container",
actionButton("calculate", "Calcular\nAlocação",
class = "btn-primary action-button"),
actionButton("reset_axis", "Ajustar\nGráfico",
class = "btn-secondary action-button")
)
),
card(
full_screen = TRUE,
card_header("Distribuição de Lugares"),
plotlyOutput("seats_plot")
)
)
server <- function(input, output, session) {
# Define a color palette for parties
party_colors <- c("#FF9999", "#66B2FF", "#99FF99", "#FFCC99", "#FF99CC", "#99CCFF", "#FFB366", "#FF99FF")
# Reactive values for controlling the animation
rv <- reactiveValues(
current_round = 0,
is_running = FALSE,
results = NULL,
y_axis_max = NULL
)
# Parse votes data
votes_data <- reactive({
req(input$party_votes)
parse_party_votes(input$party_votes)
})
# Start calculation when button is clicked
observeEvent(input$calculate, {
req(votes_data())
rv$results <- calculate_dhondt(votes_data(), input$n_seats)
rv$current_round <- 0
rv$is_running <- TRUE
rv$y_axis_max <- input$n_seats
})
# Reset y-axis when button is clicked
observeEvent(input$reset_axis, {
rv$y_axis_max <- max(current_state()$Seats) + 1
})
# Auto-increment counter
observe({
if (rv$is_running) {
invalidateLater(input$animation_speed * 1000) # Convert seconds to milliseconds
isolate({
if (rv$current_round < input$n_seats) {
rv$current_round <- rv$current_round + 1
} else {
rv$is_running <- FALSE
}
})
}
})
# Current state based on round
current_state <- reactive({
req(votes_data())
if (is.null(rv$results) || rv$current_round == 0) {
# Initial state: all zeros
seats <- rep(0, length(votes_data()))
names(seats) <- names(votes_data())
data.frame(
Party = names(votes_data()),
Votes = votes_data(),
Seats = seats
)
} else {
# Get state at current round
round_data <- rv$results$steps[rv$results$steps$Round <= rv$current_round,]
latest_state <- round_data[round_data$Round == rv$current_round,]
data.frame(
Party = latest_state$Party,
Votes = votes_data()[latest_state$Party],
Seats = latest_state$Seats
)
}
})
# Seats bar plot
output$seats_plot <- renderPlotly({
req(current_state())
# Assign colors to parties (cycling through the color palette if needed)
n_parties <- nrow(current_state())
colors <- party_colors[1:min(n_parties, length(party_colors))]
if (n_parties > length(party_colors)) {
colors <- c(colors, rep(party_colors, length.out = n_parties - length(party_colors)))
}
# If y_axis_max is NULL, set it to n_seats
if (is.null(rv$y_axis_max)) {
rv$y_axis_max <- input$n_seats
}
plot_ly(current_state(), x = ~Party, y = ~Seats, type = 'bar',
marker = list(color = colors),
text = ~Seats, # Add text for labels
textposition = 'outside') %>% # Position labels outside bars
layout(
title = list(text = paste("Lugares Distribuídos por Partido (Ronda", rv$current_round, ")")),
xaxis = list(title = "Partidos"),
yaxis = list(title = "Número de Lugares", range = c(0, rv$y_axis_max)),
showlegend = FALSE
) %>%
config(displayModeBar = FALSE) # This removes the plotly menu
})
}
shinyApp(ui, server)